India may be winning the big battle against poverty, but a closer look shows the last mile is getting harder and far more uneven.
A recent map based on NITI Aayog and India Data Map data reveals that while the national average of “no-income households” stands at just about 1.1%, some states are dealing with a very different reality.
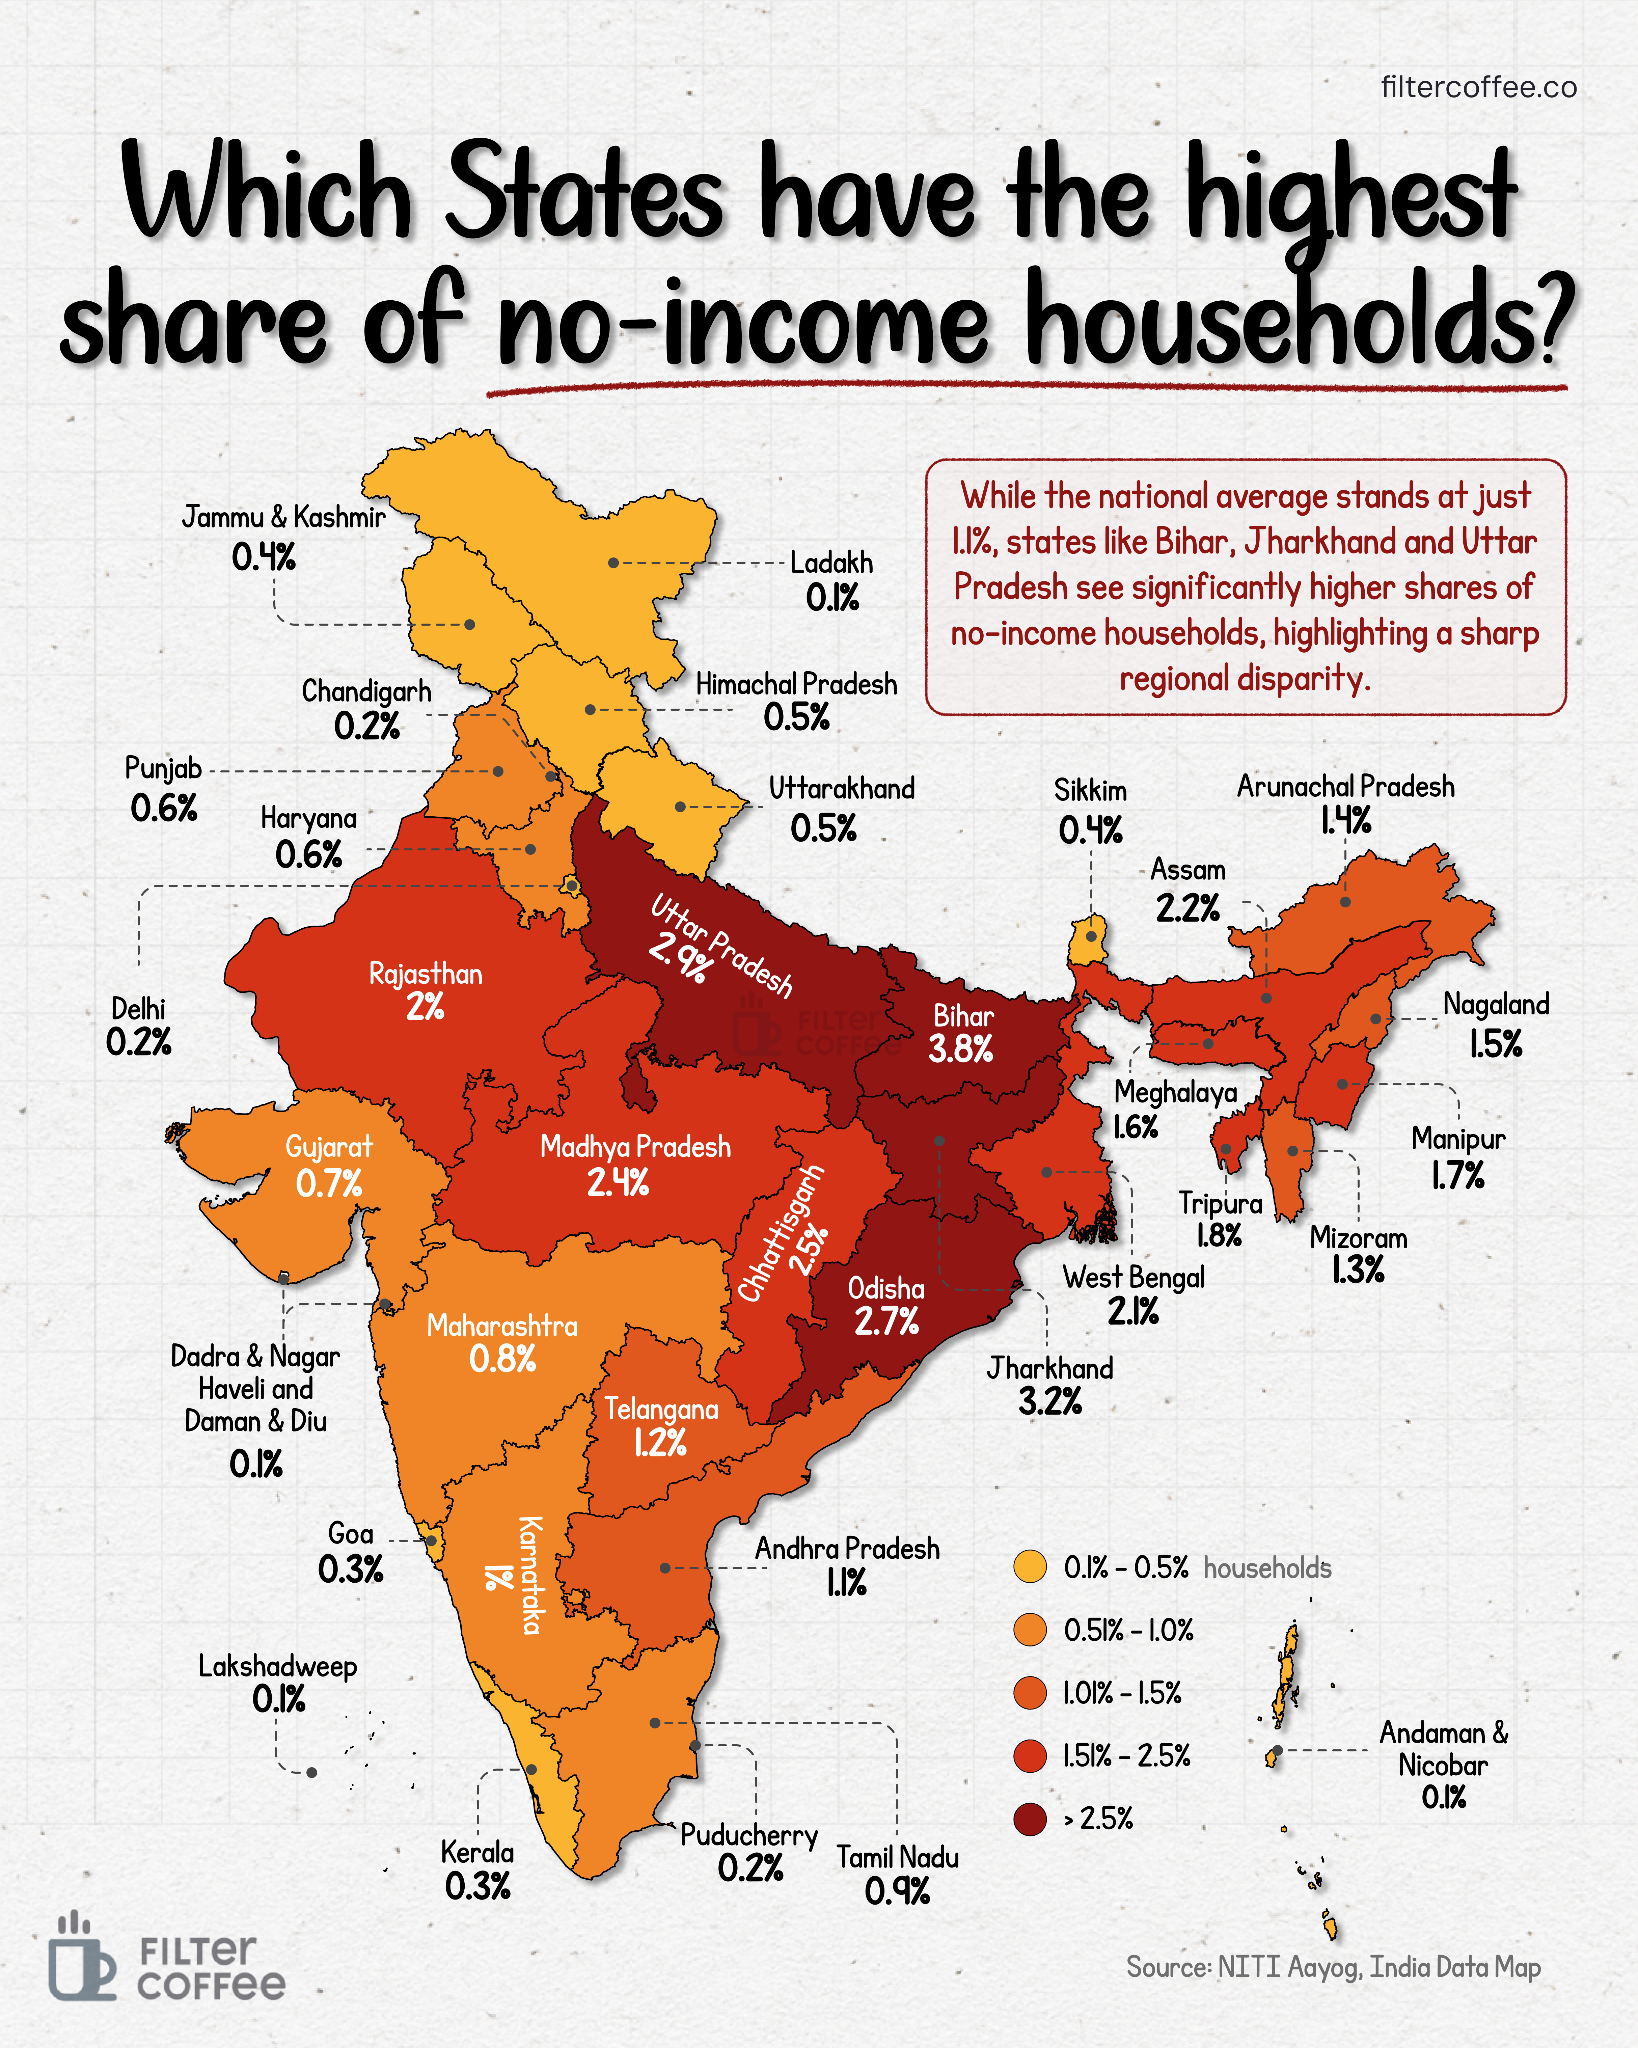
Bihar tops the list with nearly 3.8% of households reporting no income at all, followed by Jharkhand at 3.2%, Odisha at 2.7%, Chhattisgarh at 2.5% and Uttar Pradesh and Madhya Pradesh both above 2%.
In contrast, states like Kerala, Goa and Tamil Nadu are close to zero, some literally at 0.3% or lower. That gap is structural.
India has actually made massive progress in reducing poverty.
According to the World Bank, extreme poverty fell from 16.2% in 2011-12 to around 2.3% in 2022-23, lifting over 170 million people out of extreme deprivation.
NITI Aayog adds that 24.8 crore Indians moved out of multidimensional poverty in less than a decade.
States like Uttar Pradesh, Bihar and Madhya Pradesh, which show up as red on the map today, are also the ones that contributed the most to this improvement in absolute numbers.
So how can both things be true at the same time?
The answer lies in the nature of income and employment in these regions.
In many of these high-share states, a large part of the workforce is still informal, seasonal and dependent on agriculture or daily wage work. That means income is not just low, it is irregular.
A household might earn during harvest season or through migration to cities, but there are months when there is literally no inflow of cash and this is what shows up as “no-income households” in surveys.
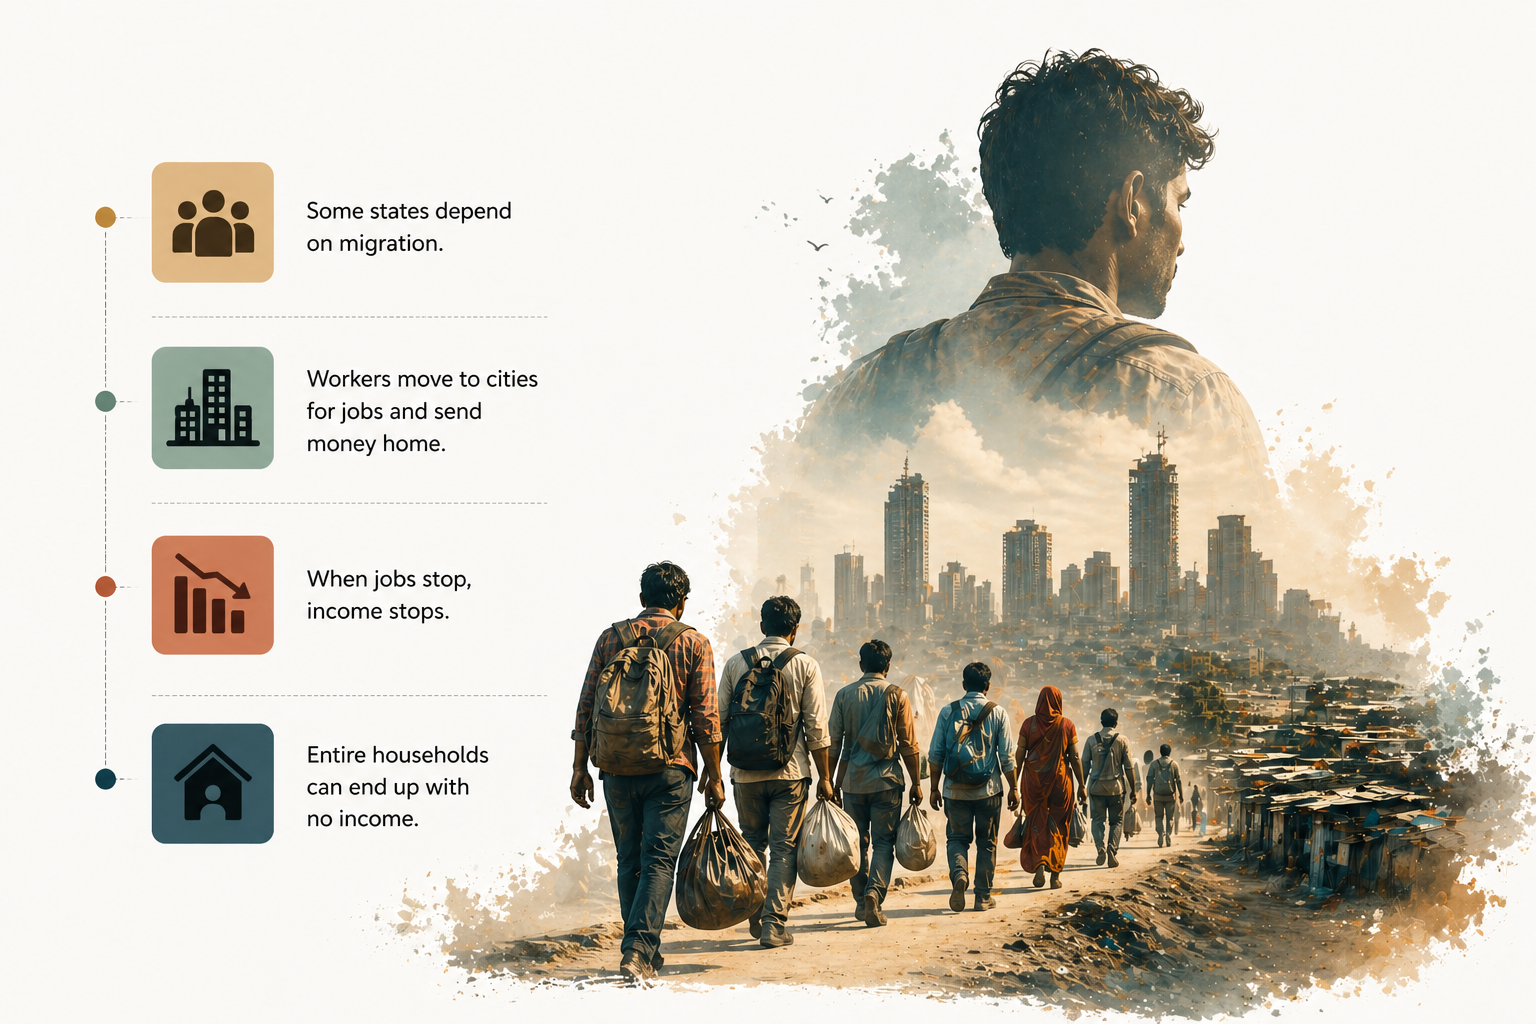
Migration plays a big role here.
States like Bihar, Jharkhand and eastern UP have historically been labour-supplying regions. Families often depend on remittances from one or two members working in cities like Delhi, Mumbai or Surat.
When disruptions happen, like during Covid or even due to slowdowns in construction or manufacturing, that income pipeline breaks and suddenly, entire households fall into the no-income category, at least temporarily.
That is why these states show higher shares even when poverty is falling overall.
Urbanisation is another layer.
Southern and western states have more diversified economies with stronger manufacturing and services sectors.
Kerala, Tamil Nadu, Maharashtra and Gujarat offer more stable employment opportunities, which reduces the chances of households reporting zero income. On the other hand, states with lower industrialisation and weaker urban ecosystems are more exposed to income shocks.
There is also a welfare angle.
Over the last decade, schemes like MGNREGA, free foodgrain distribution and direct benefit transfers have acted as safety nets and have reduced extreme poverty significantly, which is why India’s headline numbers look so good.
But these schemes often provide consumption support rather than steady income. A household may not go hungry, but it may still report no earned income in a given period.
Here’s a striking contrast that sums up the story.
Bihar’s share of no-income households is more than 12 times that of Kerala. Yet Bihar is also one of the biggest contributors to India’s poverty reduction story. This tells you that progress is happening, but the starting point was so low that gaps still remain wide.
India’s poverty story is changing and it is no longer just about getting people past a basic line since that is improving quickly.
The harder challenge now is creating stable, predictable income streams in the regions that have historically lagged behind.
Until that happens, these pockets of vulnerability will continue to show up on maps like this, reminding us that the story of growth in India is still deeply uneven.